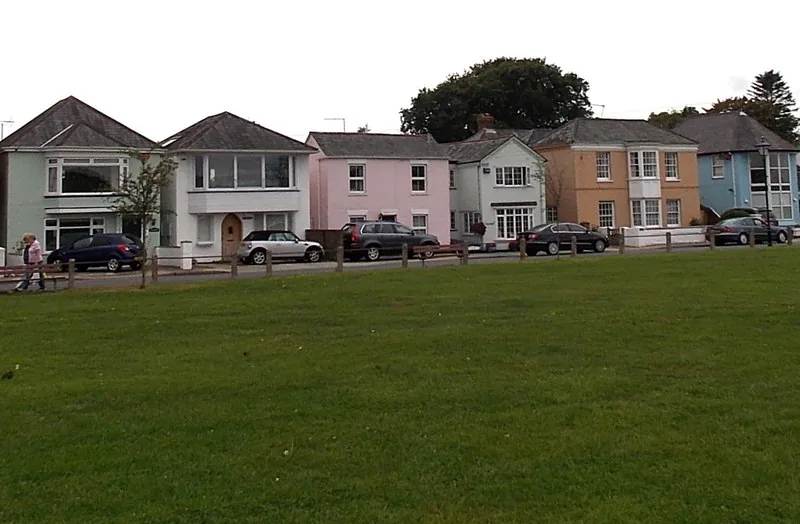

The average New Forest home sold for £380,310 in June 2026, still 9.2% below the 2022 peak. Prices by town and property type, from Land Registry sales.
New Forest district is one of the few places in the South East where the average home is still worth noticeably less than it was in 2022. The average sold price in June 2026 was £380,310. The peak was £418,782 in September 2022, so a typical New Forest home is about £38,000, or 9.2 per cent, below where it was nearly four years ago, and the recovery that England as a whole has managed has not happened here yet.
That district figure also hides more than it shows. Brockenhurst and Totton sit in the same local authority and are eleven miles apart on the same railway line, and the gap between their average sold prices is close to half a million pounds. This page takes the official numbers apart: the district average and where it is heading, what you pay by property type, and what each town actually costs.
The district figure, and why it is lower than you expect
The average home in New Forest district sold for £380,310 in June 2026, the most recent month published in the UK House Price Index, which is built from completed HM Land Registry sales rather than asking prices.
Over the twelve months to June 2026 that average rose 1.2 per cent. Hampshire as a county rose 1.4 per cent over the same year and England 1.8 per cent. The South East managed only 0.3 per cent, so on the year the district is running ahead of its own region and behind the country.
The clearest way to see it is the index itself, which the Land Registry rebases so that 2023 equals 100. In June 2026 New Forest sat at 92.0. Hampshire was 97.9, the South East 98.1, and England 102.6. In other words, England has recovered past its 2023 level while New Forest is still eight points short of it.
| Area | Average price | Change over the year | Index (2023 = 100) |
|---|---|---|---|
| New Forest district | £380,310 | +1.2% | 92.0 |
| Hampshire | £364,281 | +1.4% | 97.9 |
| South East | £380,380 | +0.3% | 98.1 |
| England | £293,262 | +1.8% | 102.6 |
All four figures come from the UK House Price Index for June 2026, built from HM Land Registry completed sales, and all are provisional until later sales register.
One number surprises people who know the area: New Forest is only about £16,000 above the Hampshire average and within £70 of the South East average, despite containing some of the most expensive villages in the county. That is a mix effect. The district runs from Brockenhurst and Lymington at one end to Totton, Hythe and the Waterside at the other, and it holds a very large stock of retirement flats along the coast at New Milton, Barton on Sea and Milford. Flats are the one property type still falling, and there are a lot of them here.
What you pay by property type
These are the district averages for June 2026 from the UK House Price Index:
- Detached: £576,165, up 0.9% over the year.
- Semi-detached: £366,192, up 2.2%.
- Terraced: £296,504, up 2.2%. Semis and terraces are the joint strongest of the four.
- Flats and maisonettes: £195,788, down 0.6%, the only type still falling.
The spread is the widest thing on this page. A detached house here costs almost three times a flat. Semi-detached homes are doing the heavy lifting in the market, which is what usually happens when buyers are stretched: the money moves down a rung from detached to semi rather than out of the area.
The same data splits buyers as well as buildings. A first-time buyer paid an average of £288,704 in June 2026, up 1.6% over the year. A home mover, someone selling one property to buy another, paid £450,472. The £162,000 between those two figures is the size of the step from a first flat or terrace to a family house in this district.
What each town actually costs
The district average is close to useless if you are choosing between towns. These are average sold prices over the twelve months to summer 2026, compiled by Rightmove from the same HM Land Registry sales, for each town’s listing area:
The pattern is consistent and it is worth stating plainly: the more expensive the town, the further it still is from its own peak. Brockenhurst is 20 per cent below its 2022 high of £1,047,103. Lyndhurst is 18 per cent below. Lymington is 16 per cent below a 2022 peak of £636,457. Then, at the other end, Totton is 1 per cent above its 2022 peak, the only town on the list that has fully recovered.
That is a mortgage-rate story rather than a New Forest story. The big detached houses inside the park were bought with the cheapest borrowing in modern history, and when that ended the top of the market lost the most ground. Totton’s semis, at £339,840, are priced where a normal salary and a normal mortgage can still reach.
The direction of travel over the last twelve months has flipped, though. Lyndhurst is up 11 per cent on the previous year and Brockenhurst up 8 per cent, while New Milton is down 3 per cent. The expensive end fell first and is now moving again.
| Town | All types | Detached | Semi-detached | Change on the year |
|---|---|---|---|---|
| Brockenhurst | £833,959 | £1,052,375 | £854,667 | +8% |
| Lymington | £531,674 | £801,527 | £468,421 | +2% |
| Lyndhurst | £527,548 | £788,357 | £424,450 | +11% |
| Ringwood | £462,698 | £617,239 | £398,172 | +1% |
| New Milton | £417,546 | £549,066 | not published | −3% |
| Fordingbridge | £357,717 | £436,579 | £356,958 | +1% |
| Totton | £338,557 | £461,020 | £339,840 | +5% |
Those town figures come from Rightmove sold prices, compiled from HM Land Registry, and they cover each town’s listing area rather than a parish or ward boundary.
Two figures in that table are worth pausing on. Brockenhurst semi-detached homes average £854,667, more than a detached house anywhere else in the district except Lymington. And New Milton flats average £215,905 against Brockenhurst flats at £358,000, which is the retirement-coast market and the forest-village market sitting in the same council area.
What it means if you are buying, selling or staying
If you are buying in the forest villages, the peak-to-now gap is real negotiating information: Brockenhurst and Lyndhurst sellers who bought in 2021 or 2022 are, on average, looking at a lower number than they paid. If you are buying in Totton or on the Waterside, that argument does not apply, because those markets have already recovered.
If you are selling, price off your town, not the district. An agent quoting “the New Forest average” at you is quoting a figure that describes Fordingbridge.
If you are staying put, the practical thing to check is the running cost rather than the capital value. The bin collection and council tax side of a New Forest home is set by New Forest District Council, and a property inside the national park boundary also comes with a different planning authority, which matters if you ever want to extend. Our page on New Forest planning explains which body decides what.
Sales are thin, which makes single months unreliable
The Land Registry also publishes how many homes actually changed hands. In New Forest district there were 155 sales in March 2026, 165 in February, 143 in January and 200 in December 2025. Those are small numbers for a district of roughly 175,000 people, and they are the reason a single month’s average can jump by several thousand pounds without anything real happening. Treat the twelve-month direction as the signal and the monthly figure as noise.
Sales volumes are also published with a longer lag than prices, so the most recent months on this page have prices but no volume yet.
Frequently asked questions
What is the average house price in the New Forest?
The average home in New Forest district sold for £380,310 in June 2026, according to the UK House Price Index built from HM Land Registry sales. That covers every property type across the whole district, from Totton to Milford on Sea.
Are New Forest house prices going up or down?
Up. Prices rose 1.2 per cent in the year to June 2026, ahead of the South East (0.3 per cent) but behind Hampshire (1.4 per cent) and England (1.8 per cent). The longer view matters more: the district average is still 9.2 per cent below its September 2022 peak of £418,782.
Which is the most expensive town in the New Forest?
Brockenhurst, by a distance. Homes there averaged £833,959 over the past year, with detached houses at £1,052,375. Lymington (£531,674) and Lyndhurst (£527,548) come next.
Where are the cheapest houses in the New Forest?
Totton, at an average of £338,557, followed by Fordingbridge at £357,717. Totton is also the only town in the district trading above its own previous peak.
How much is a flat in the New Forest?
The district average for a flat or maisonette was £195,788 in June 2026, down 0.6 per cent over the year. Flats are the only property type in the district still falling, and the coastal retirement stock at New Milton and Milford is a large part of the reason.
Where can I check what a specific house sold for?
Every completed sale in England and Wales is public. Search a street or a single address free on the HM Land Registry Price Paid service. Rightmove and Zoopla present the same data with a map on top.
Sources
- UK House Price Index, New Forest (ONS and HM Land Registry) for the district average, index, property-type and buyer-type figures and the Hampshire, South East and England comparisons.
- Land Registry UK HPI open data for the monthly series used to identify the September 2022 peak and the sales volumes.
- Rightmove sold prices for the town-level averages and peak comparisons.
- HM Land Registry Price Paid search to check any individual address.
Figures are provisional and revised as more sales complete. Confirm the latest numbers against the linked sources before you make a decision.
Have your say